Source graph
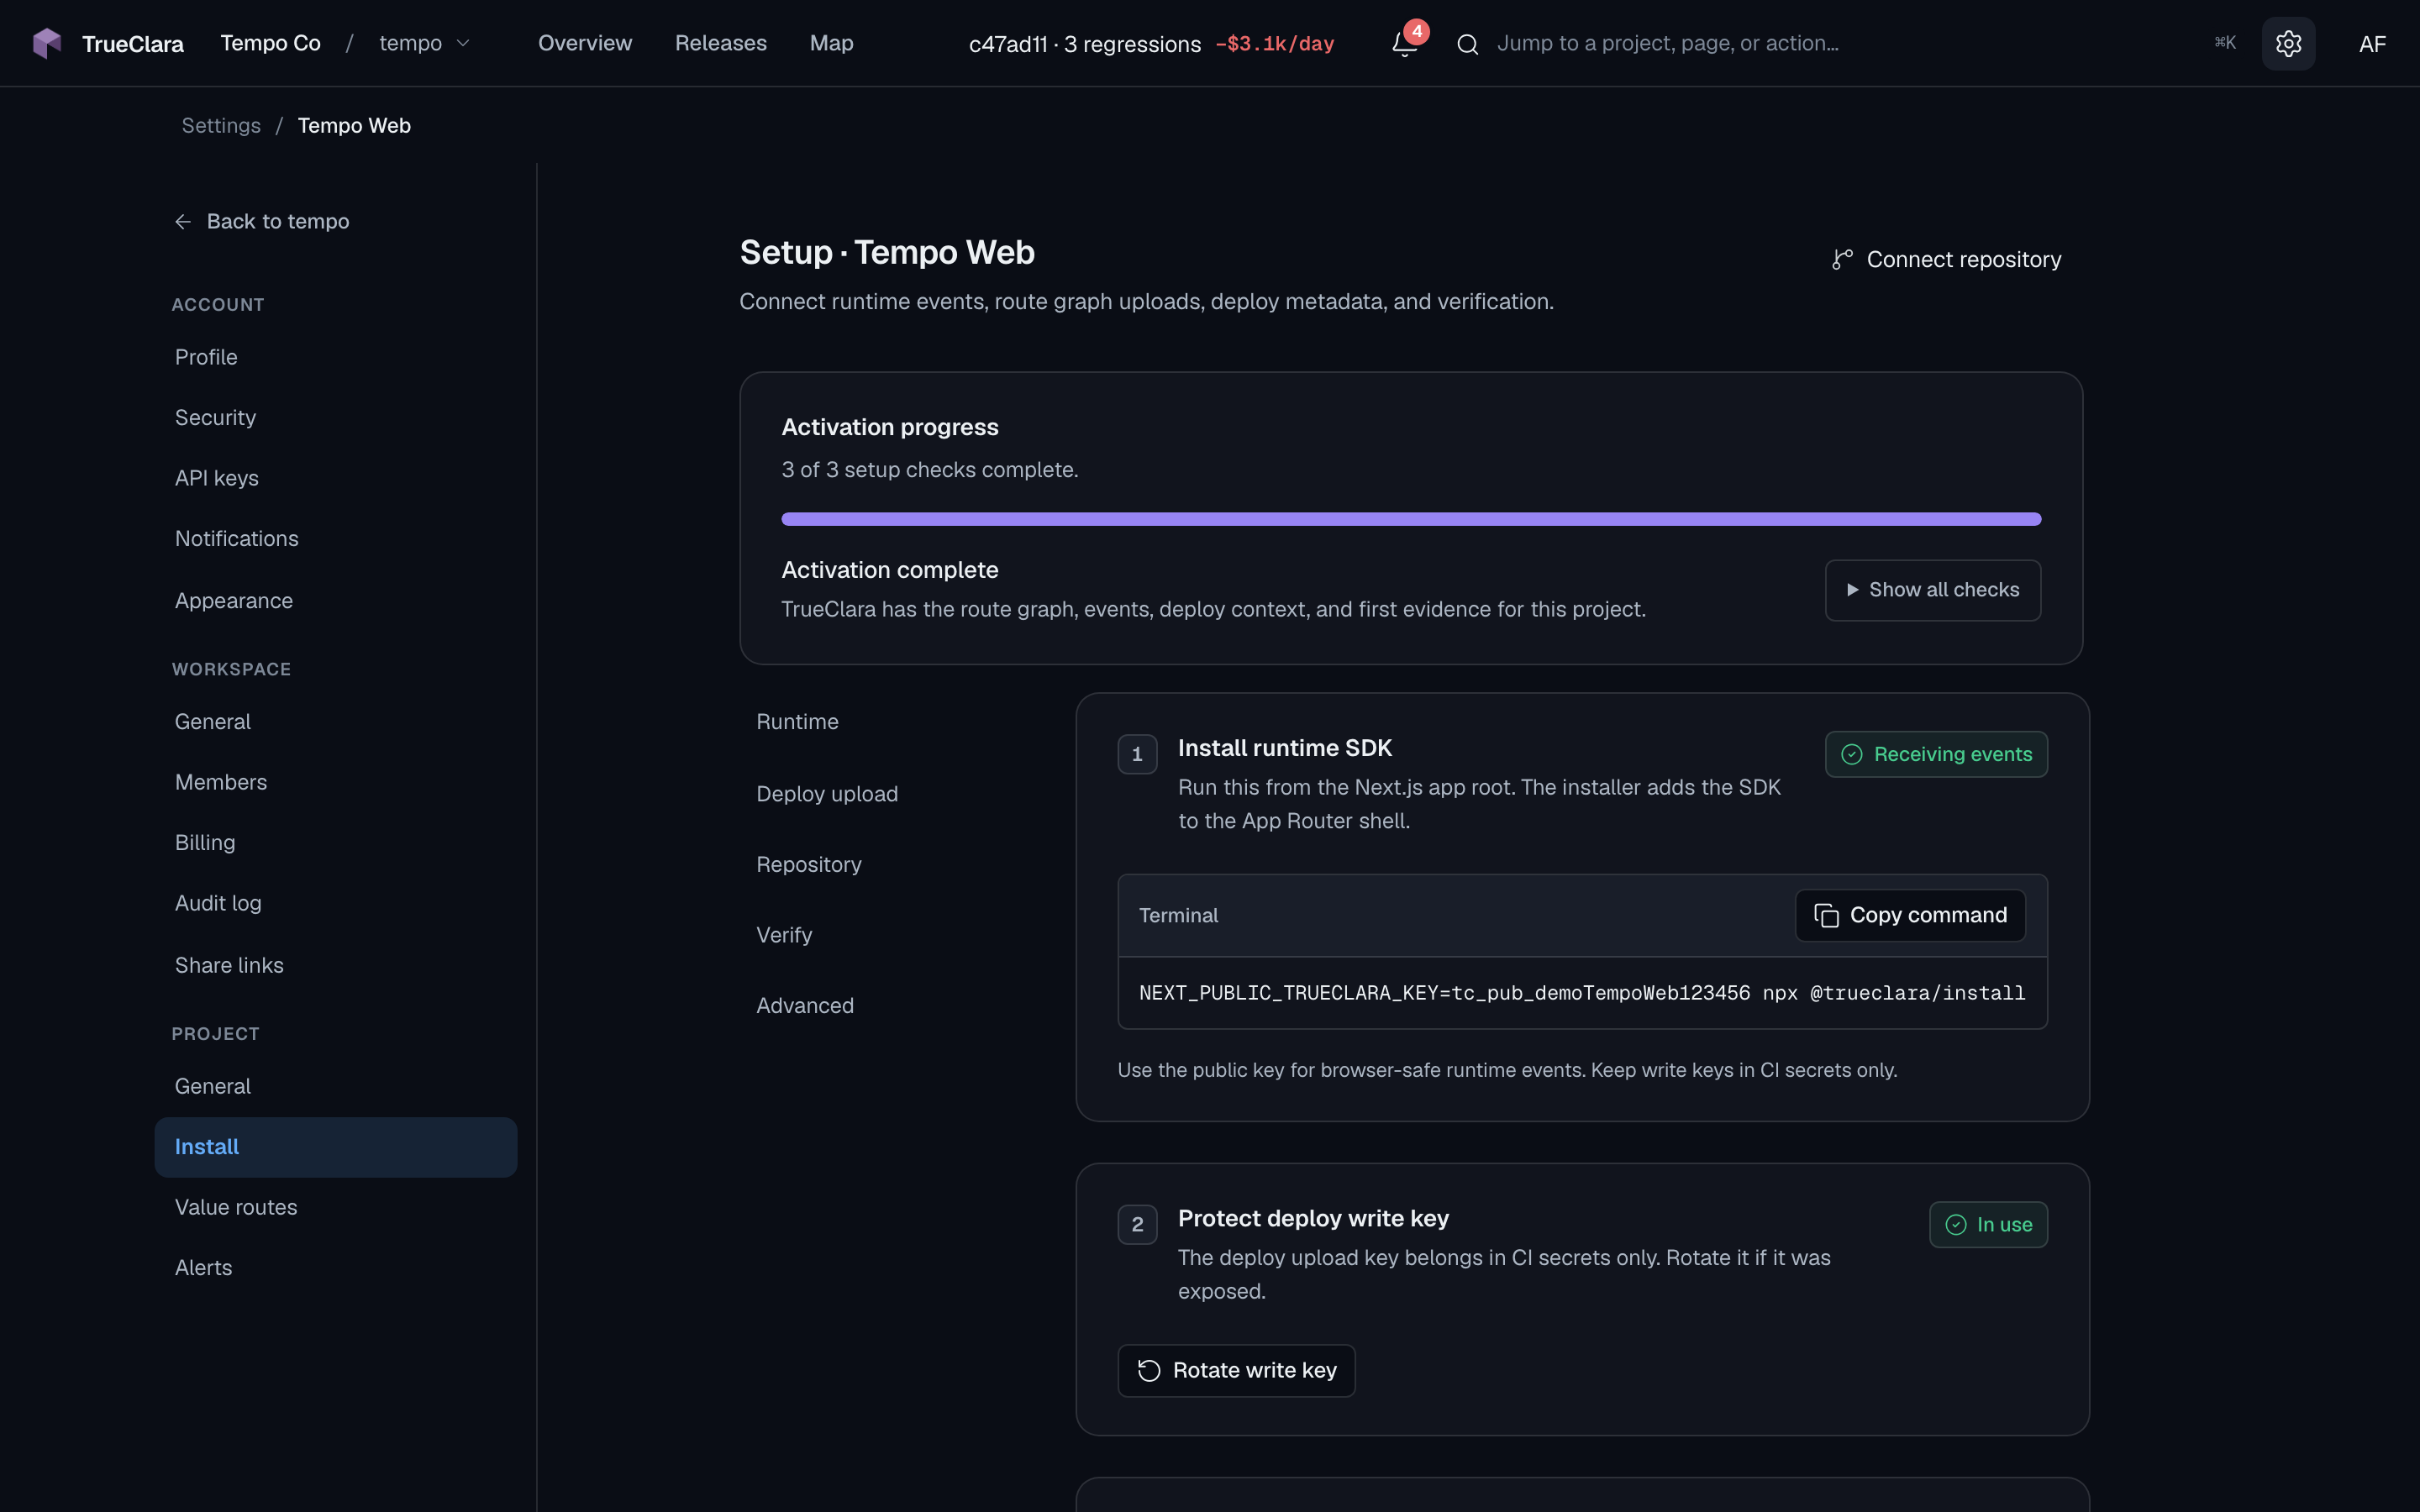
Route nodes come from the repo.
page.tsx files become route nodes, route groups collapse correctly, and dynamic segments stay generic for stable comparisons across arms.
App RouterPages RouterDynamic routes
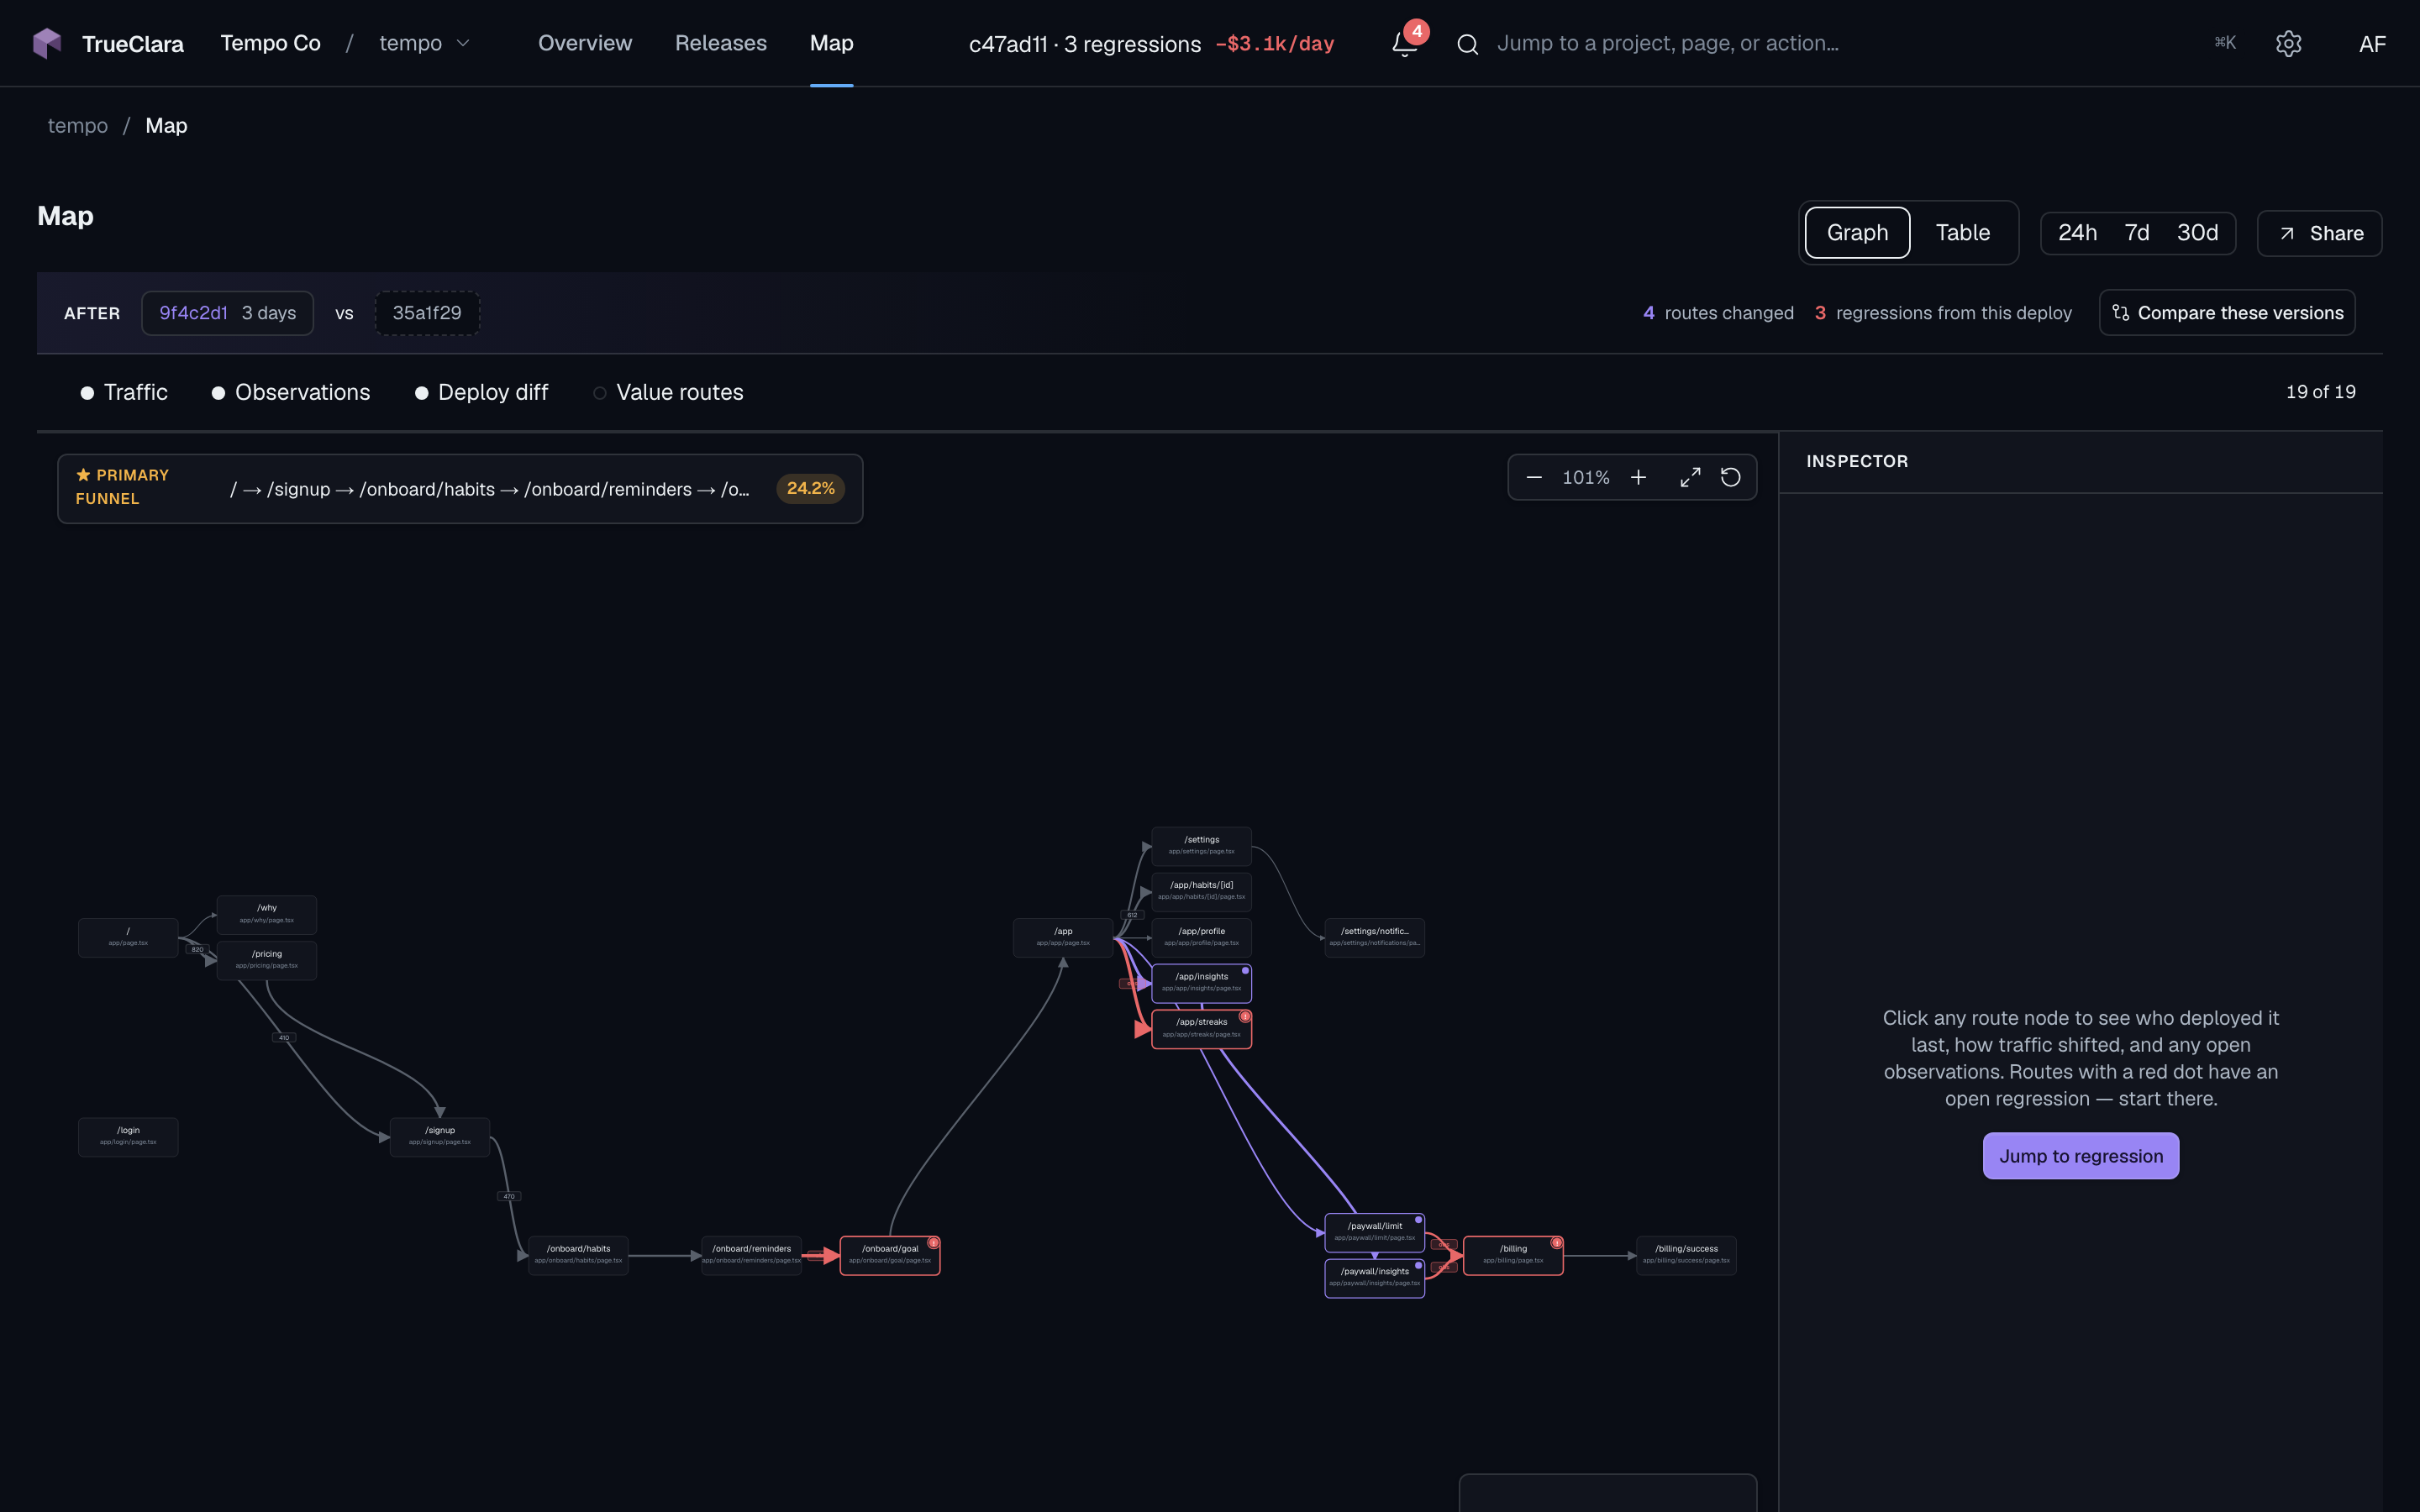
Before TrueClara can run an experiment, it needs to know what your app is. The diagram is a parser-derived graph that starts with your source tree, gains runtime weight, and scopes every canary to the routes a change can actually touch.
page.tsx files become route nodes, route groups collapse correctly, and dynamic segments stay generic for stable comparisons across arms.
TrueClara derives the expected route shape before traffic arrives, then uses runtime transitions to know which value routes a given change is in scope for.
Entries, exits, and edge transition rates tell the experiment which routes carry enough traffic to power a verdict.
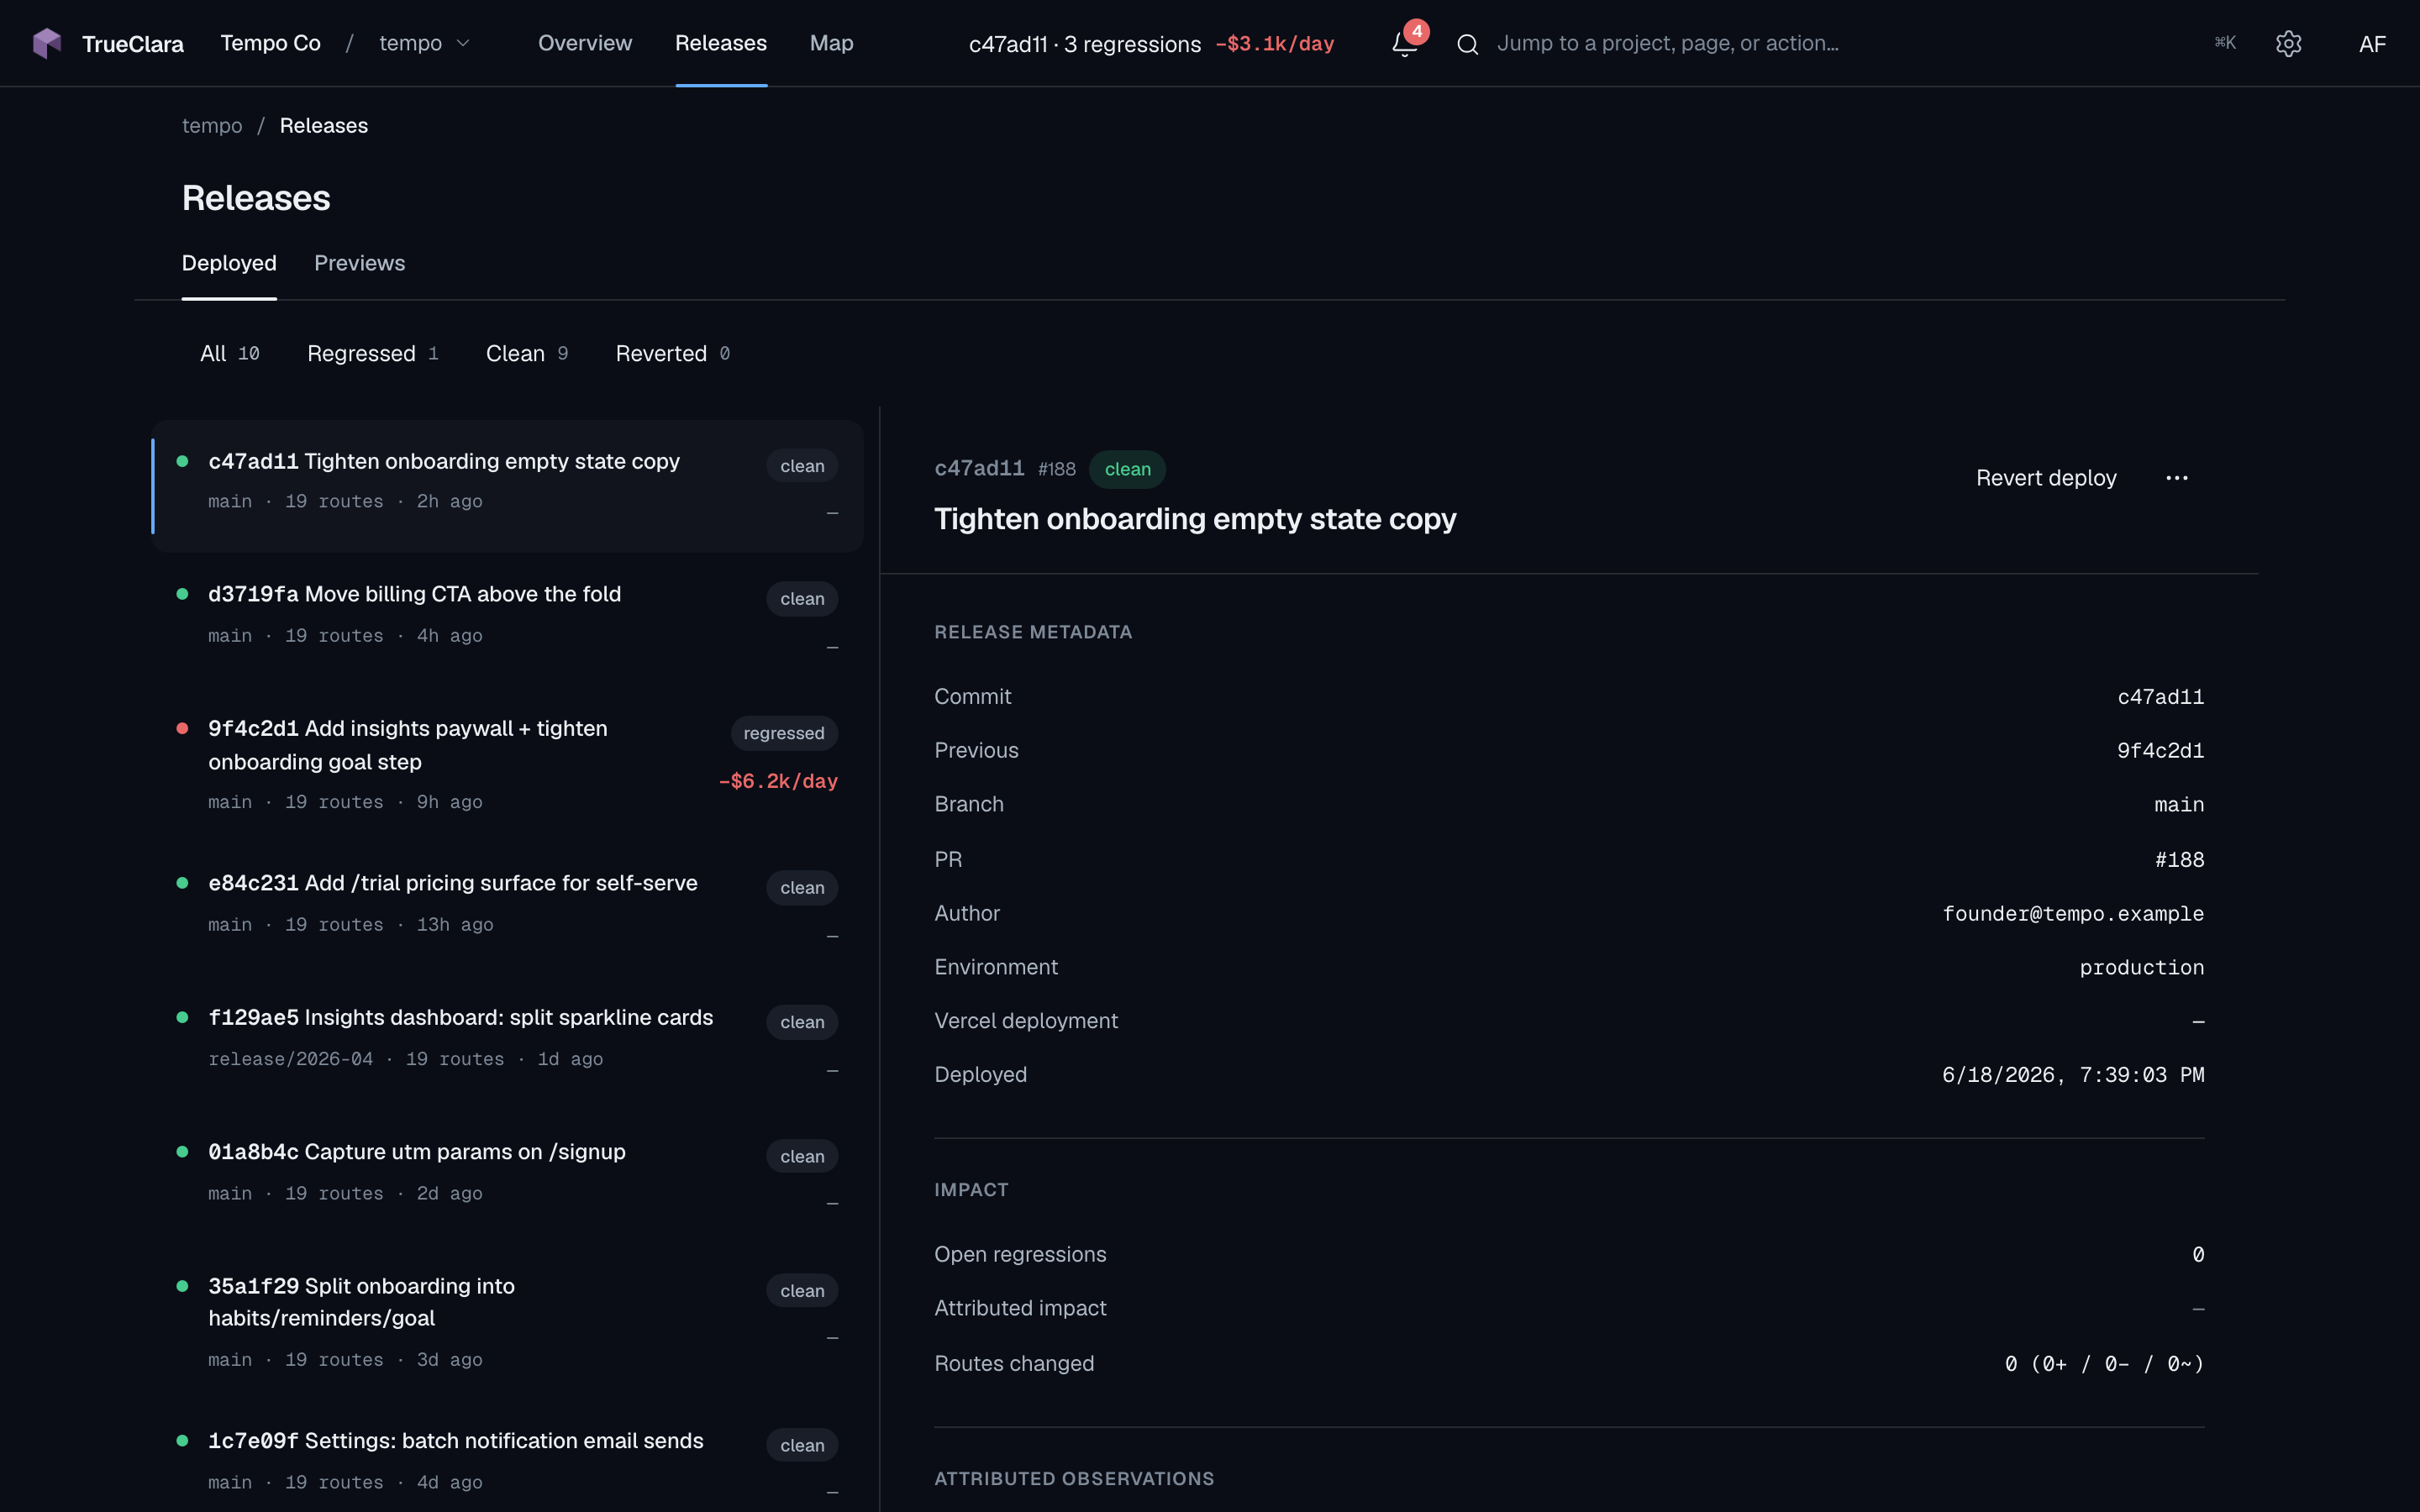
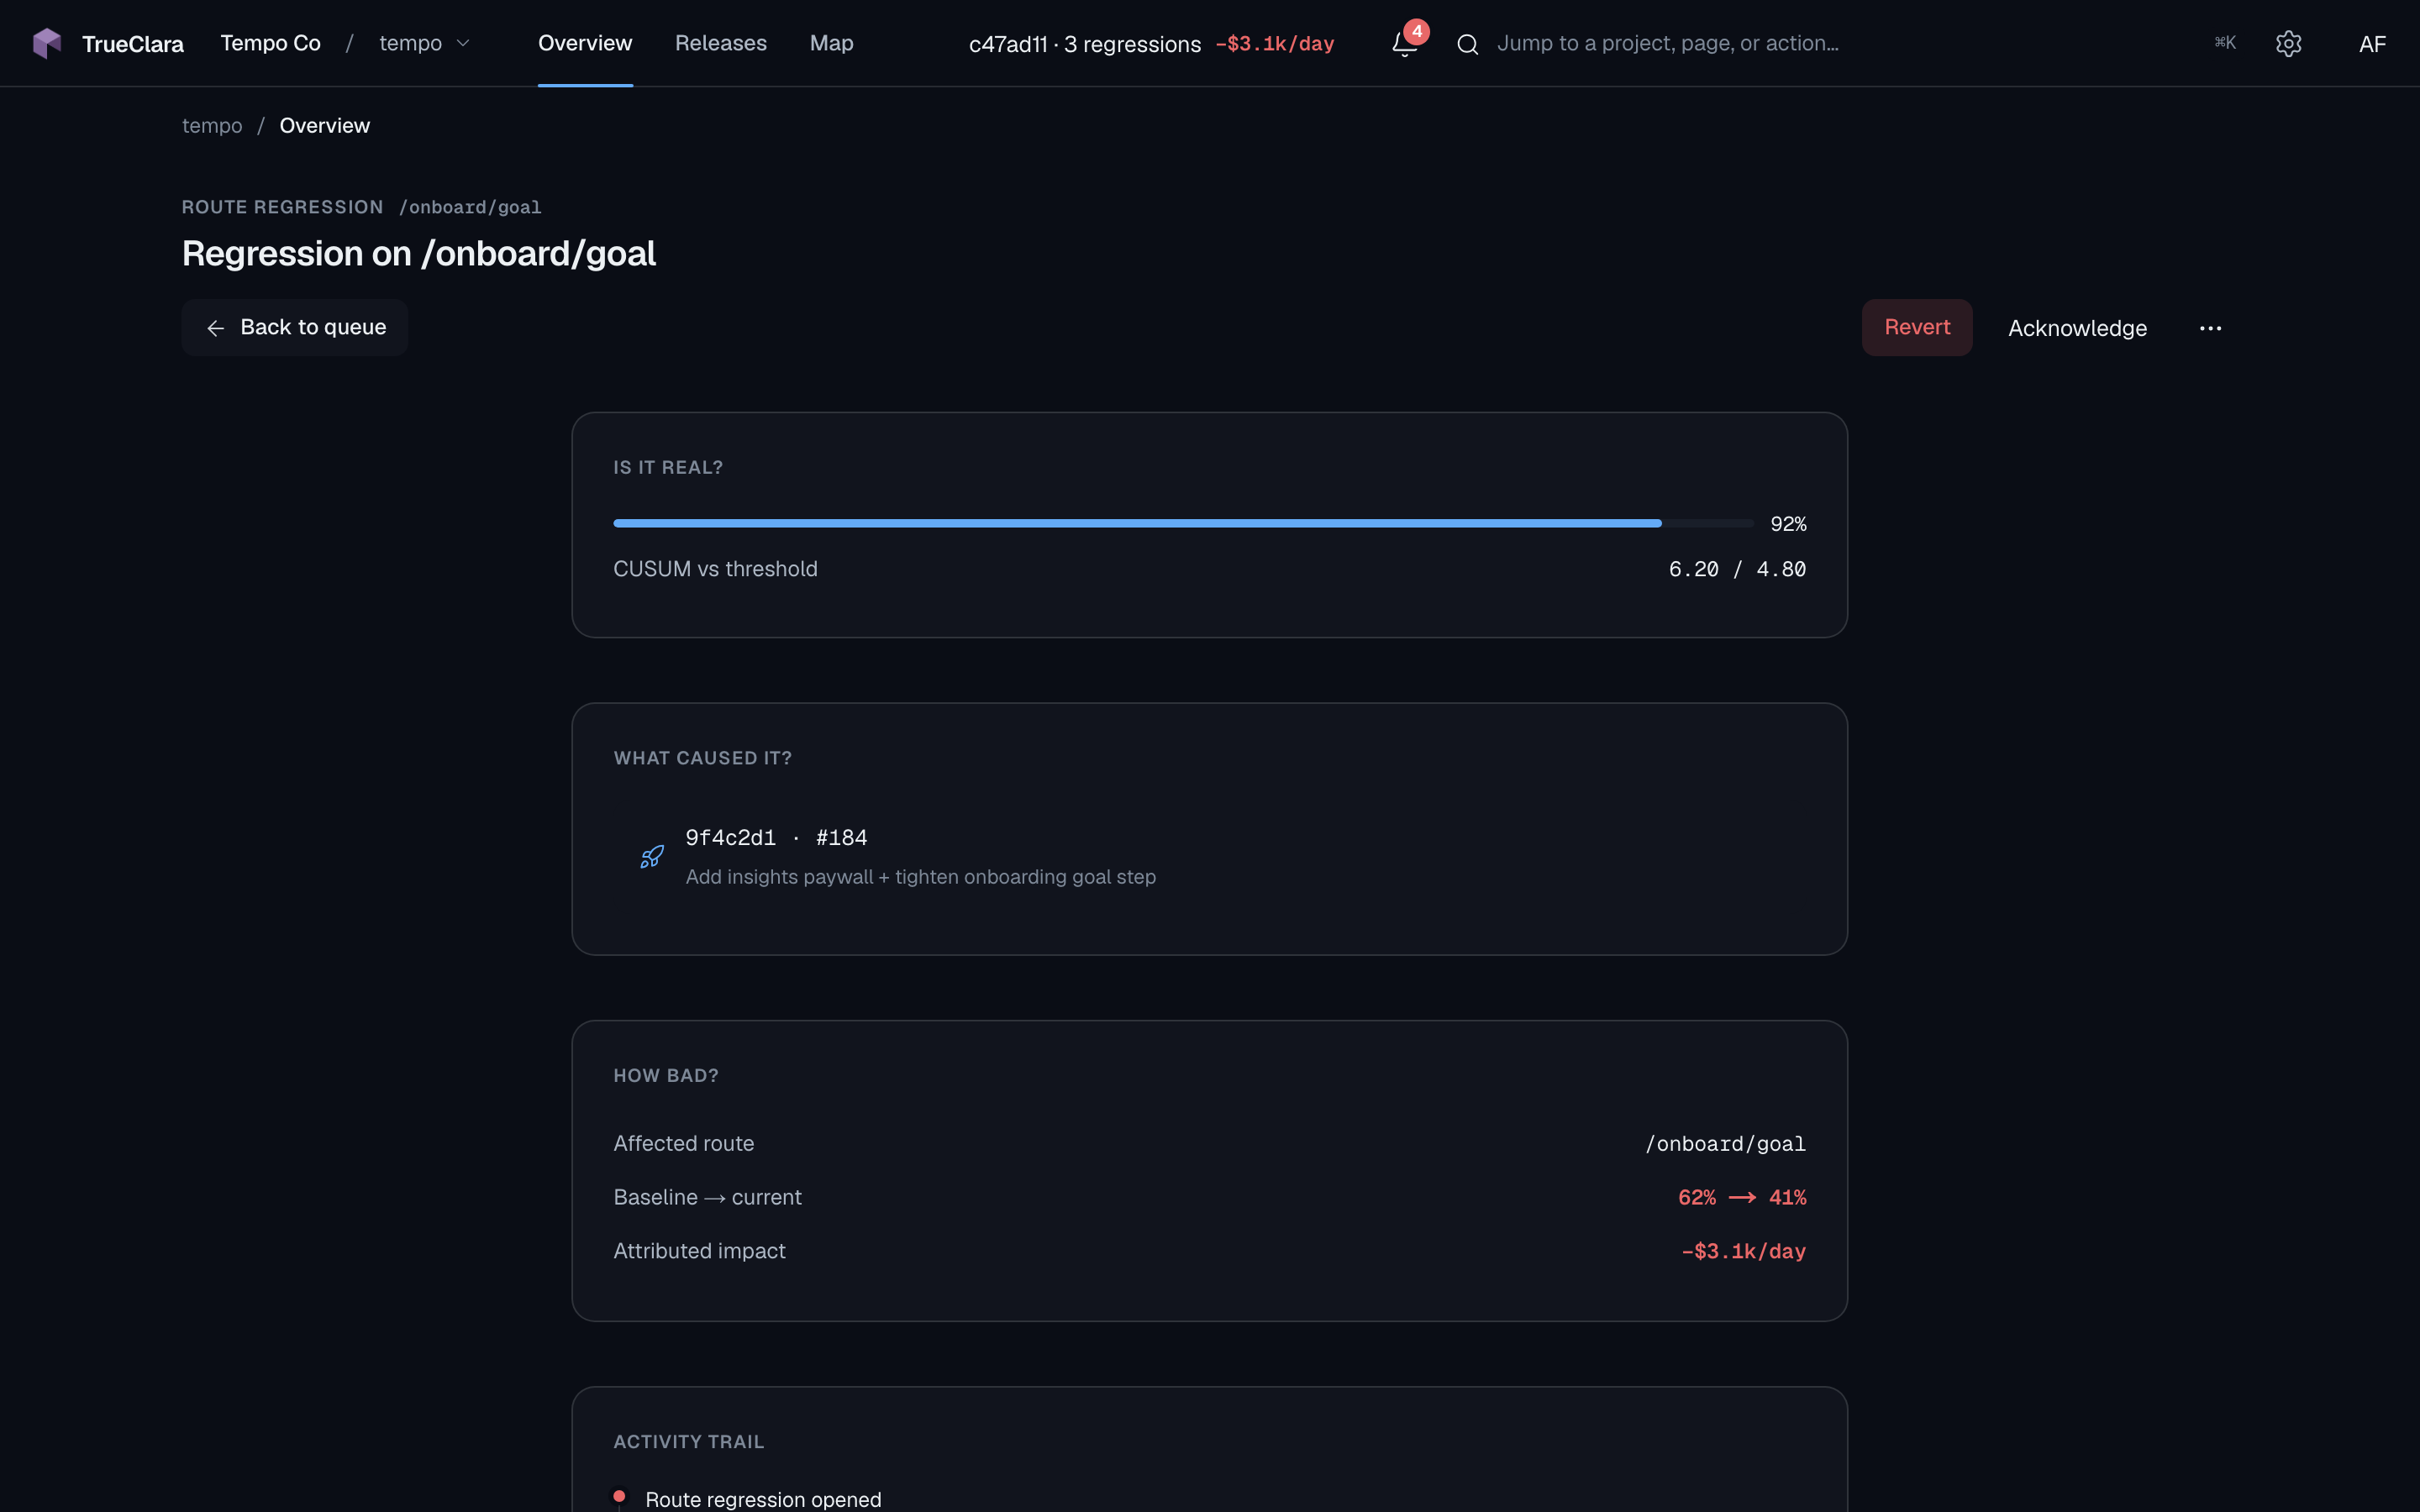
Every deploy gets a marker. The diff is how TrueClara scopes the affected routes for the canary that deploy triggers.
Source structure, runtime weight, and deploy diffs sit in one surface — so TrueClara always knows which routes a change can affect before it scopes the experiment.
Every experiment TrueClara runs is scoped by this graph — it's how the reward layer knows what to test and where the change can be felt.