Observations

Revenue regressions, with enough proof to act.

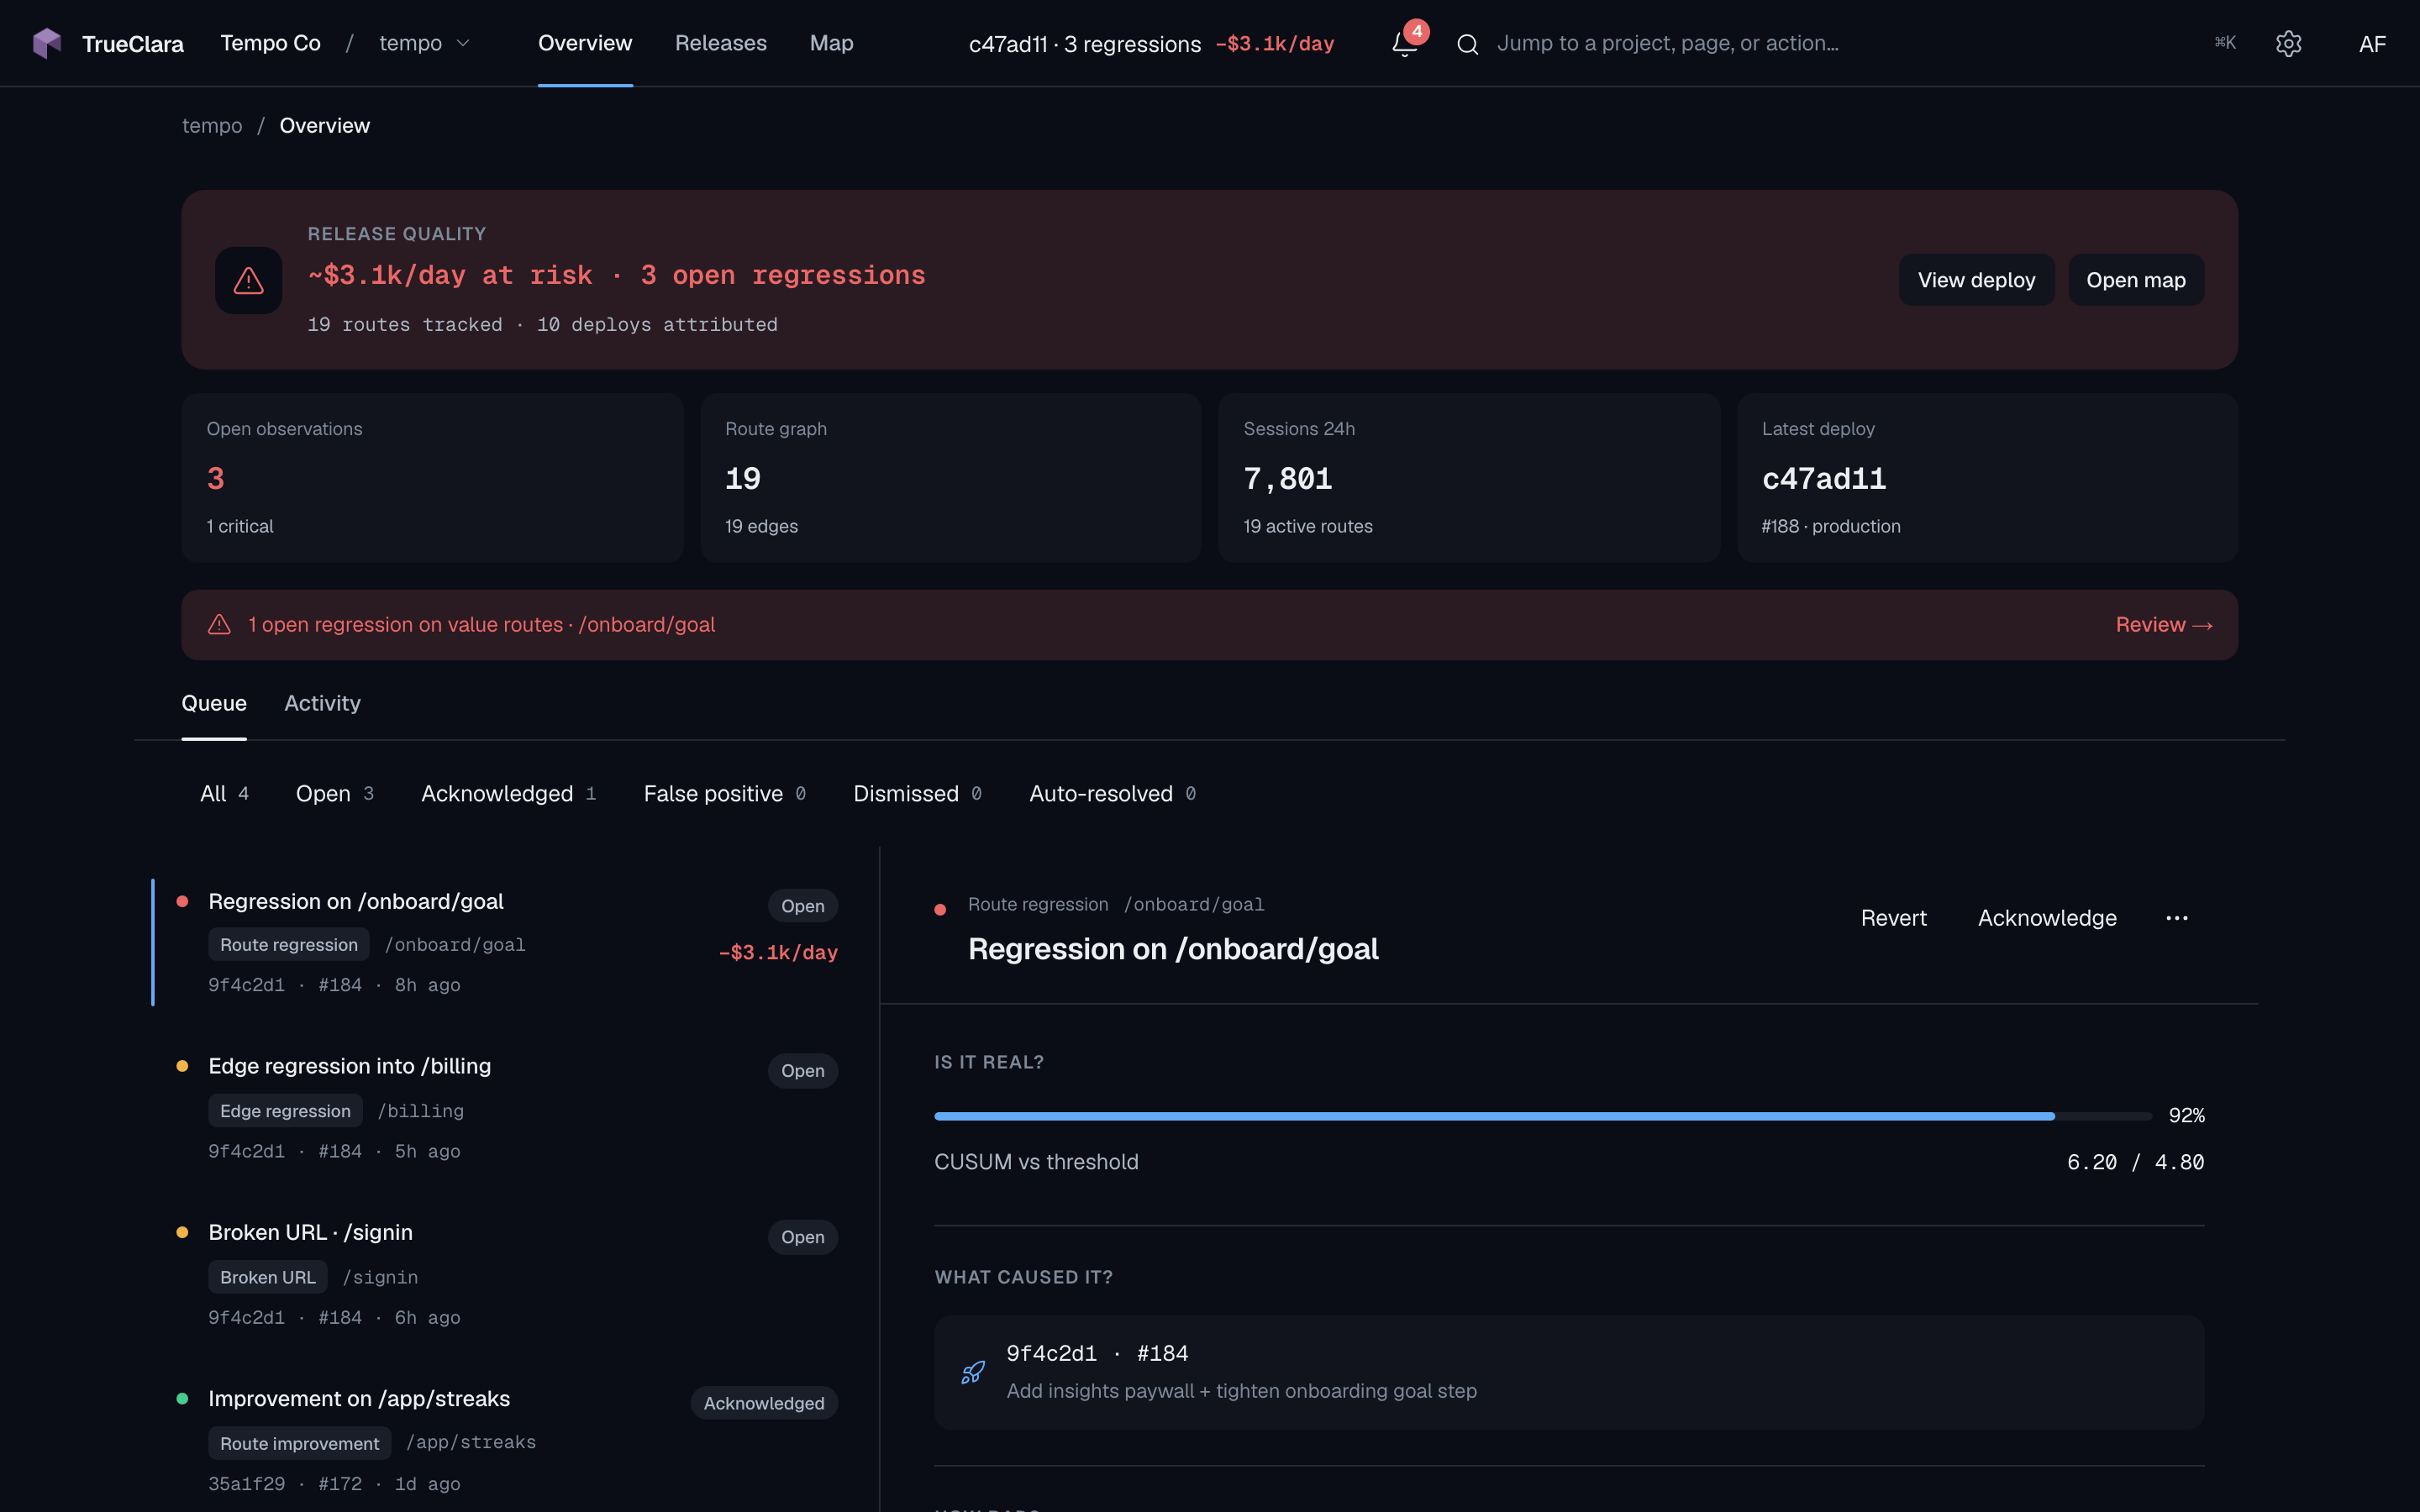
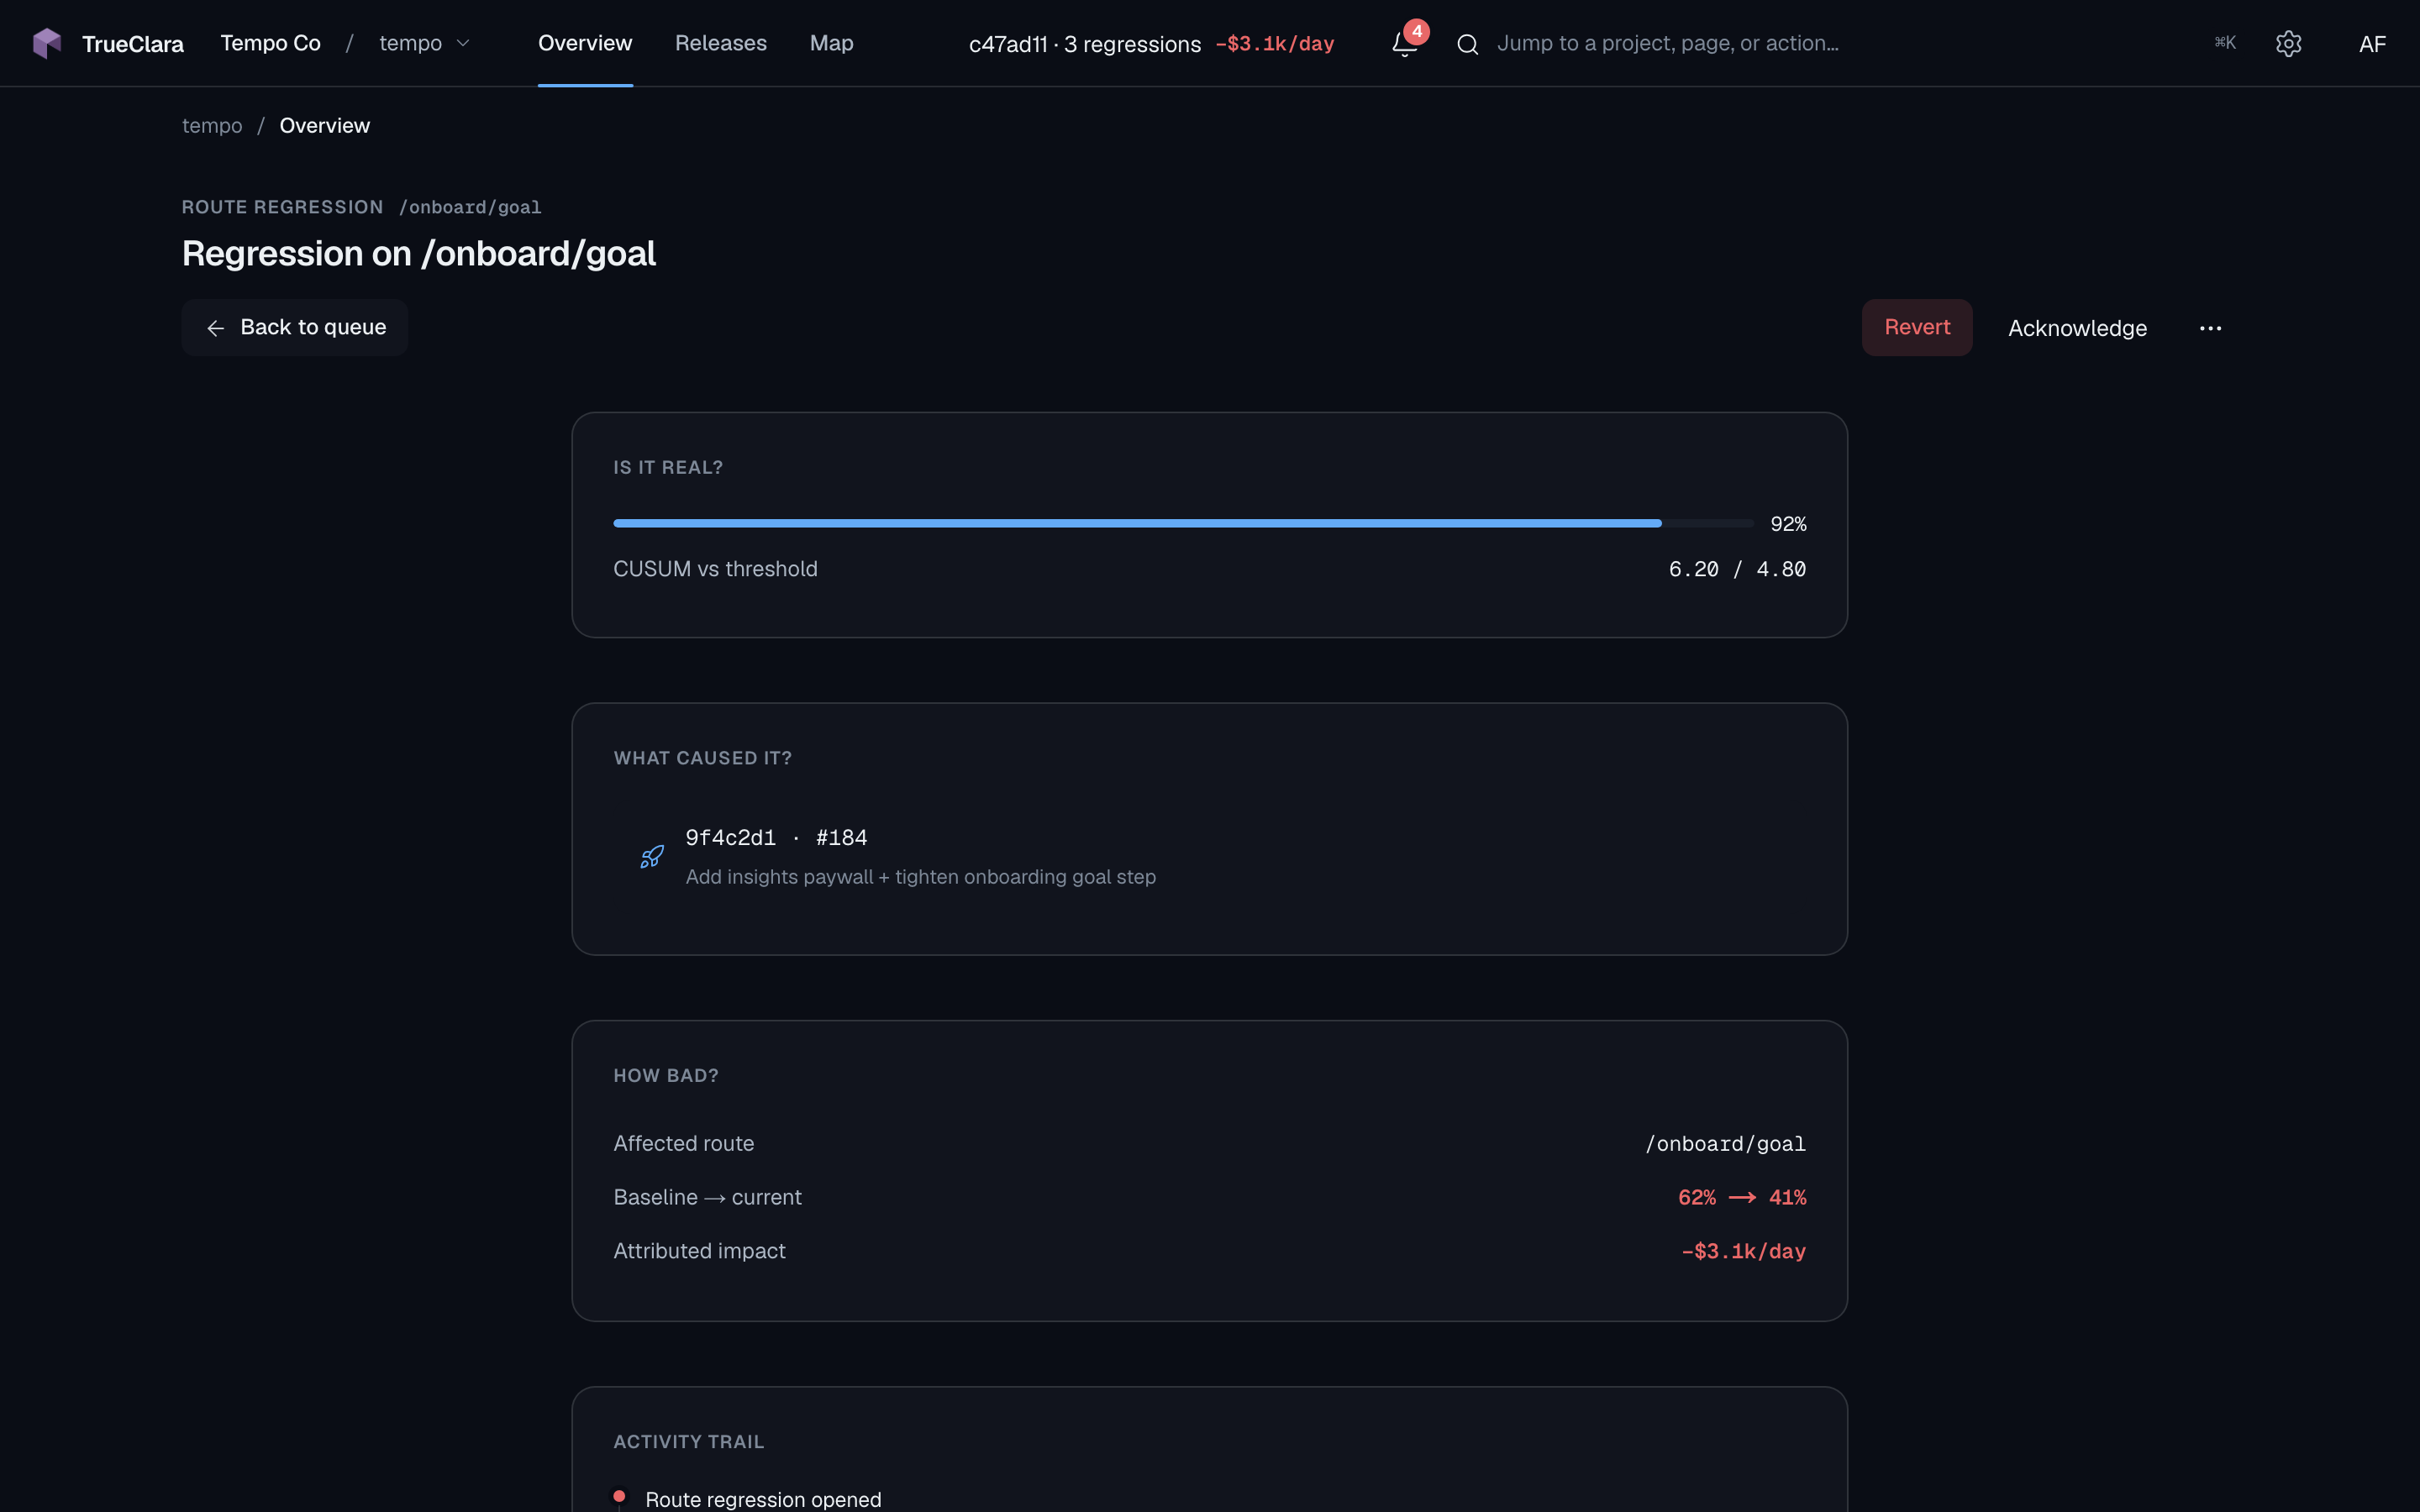
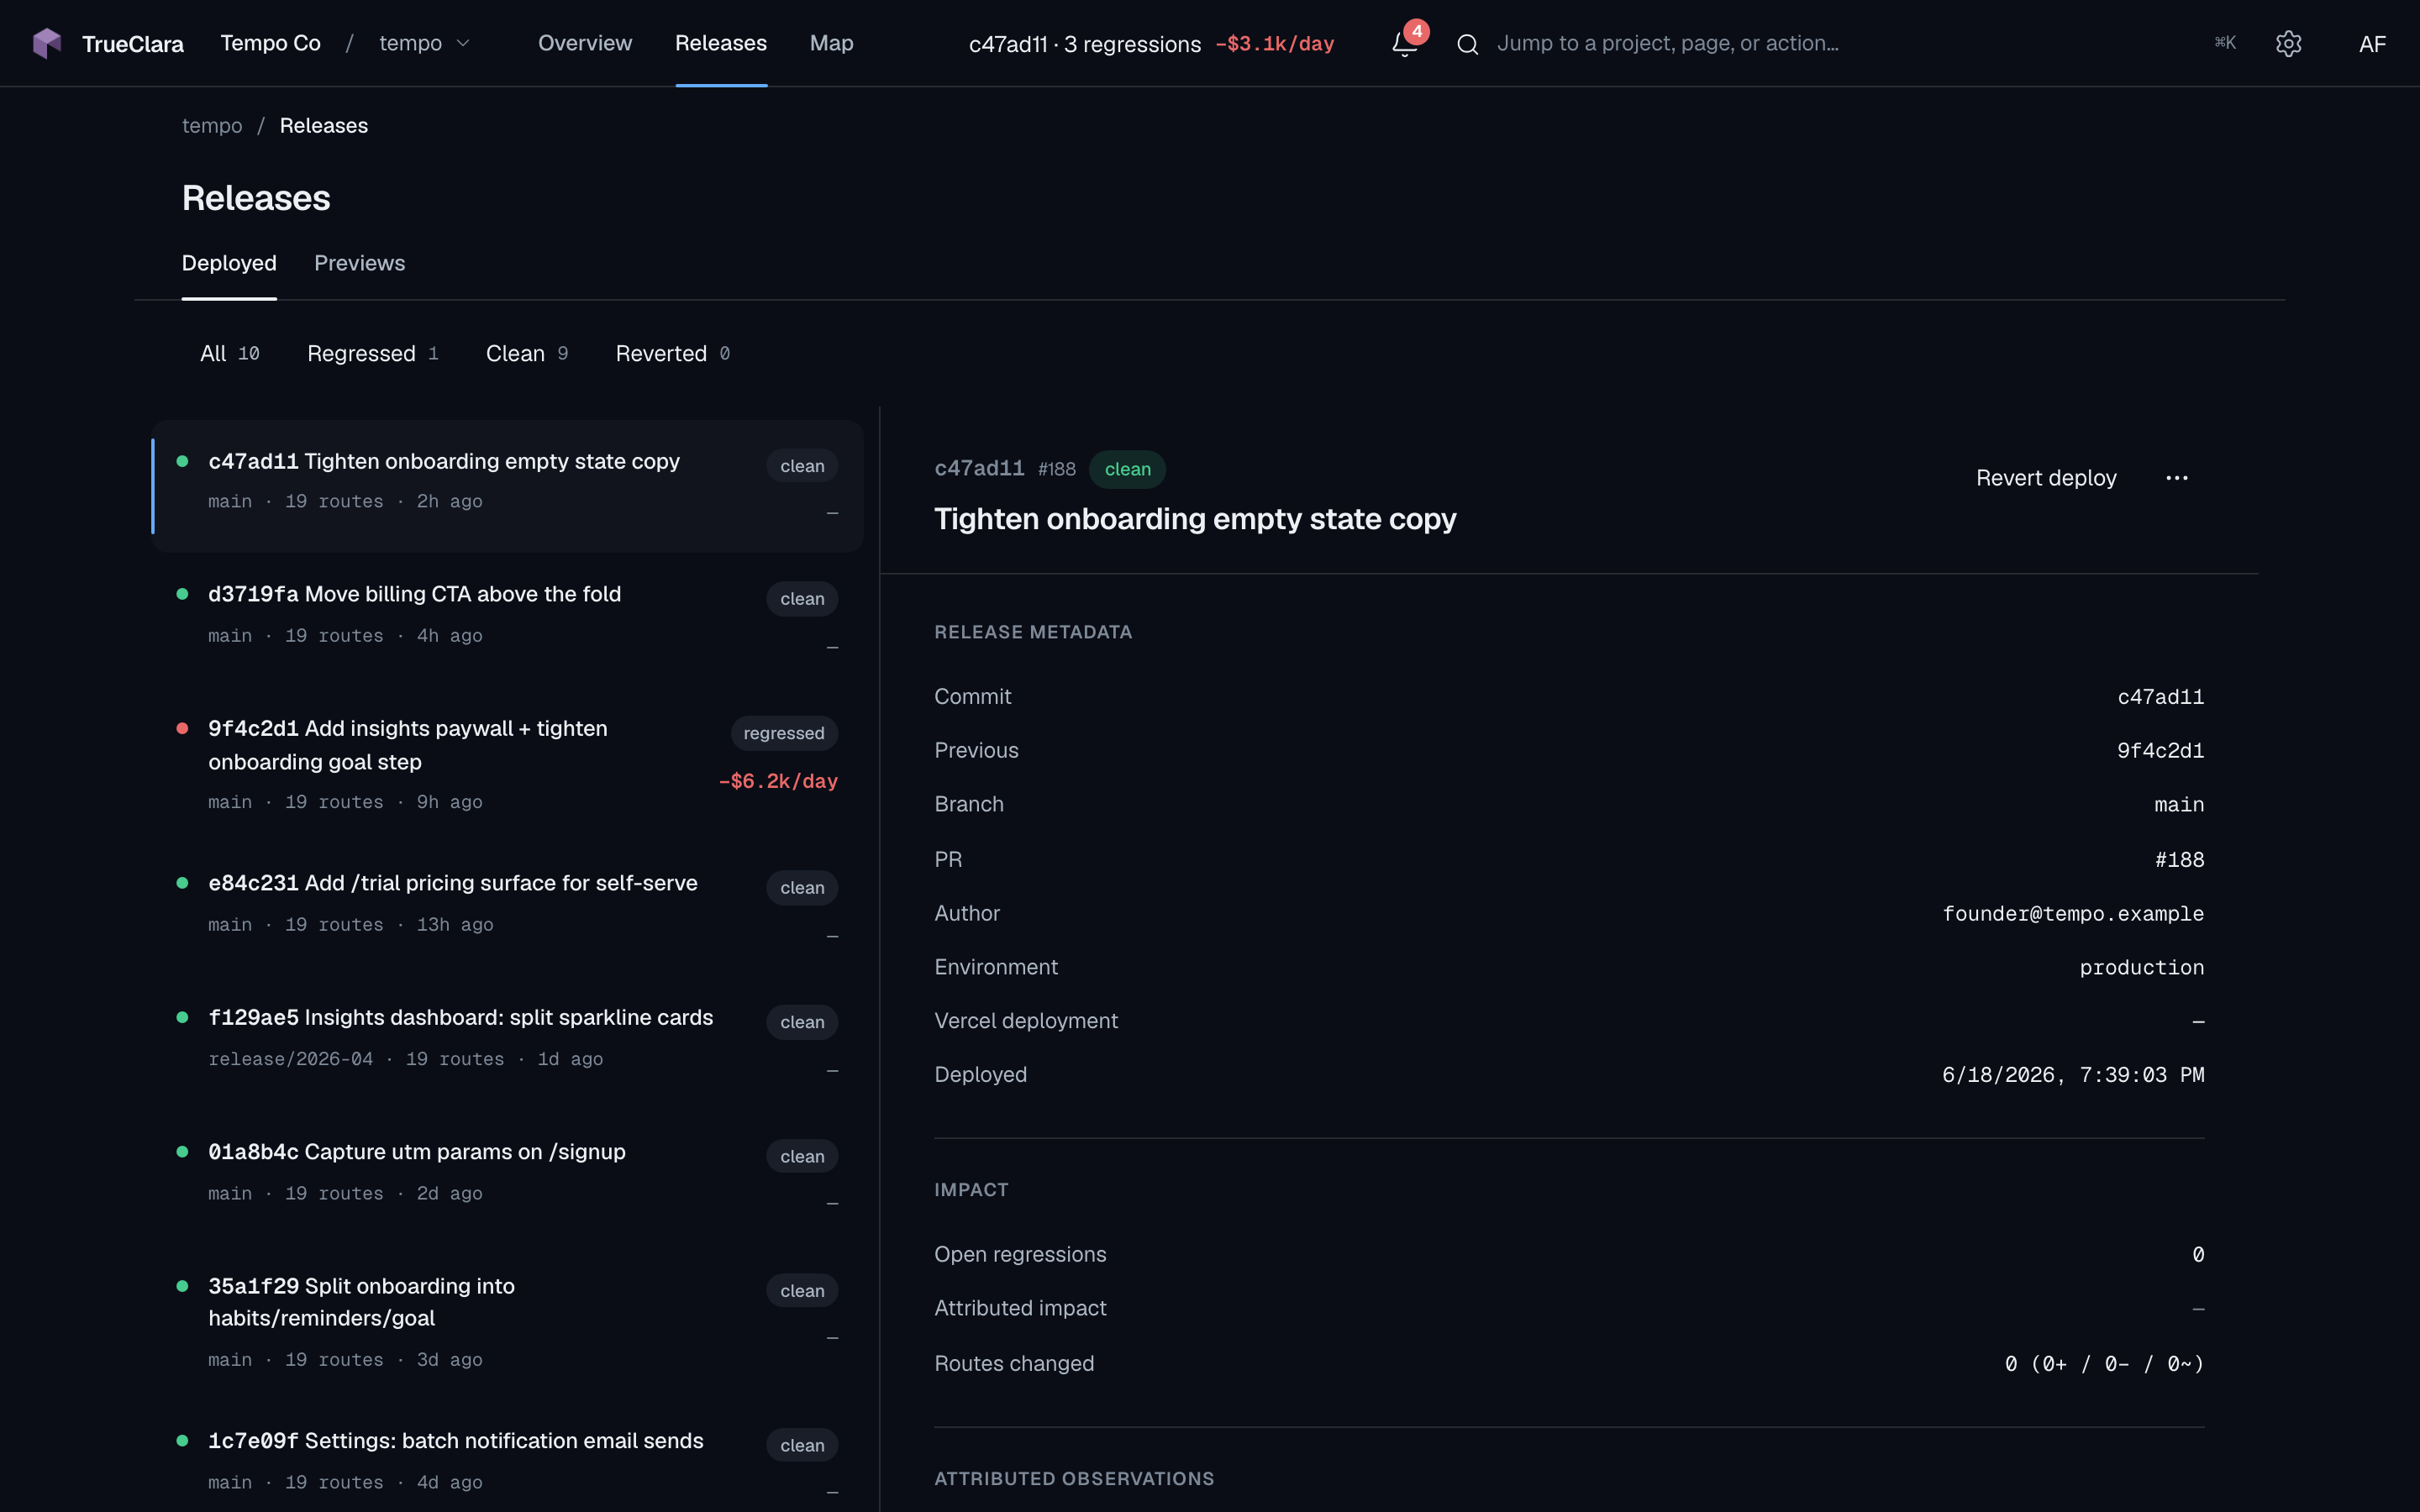
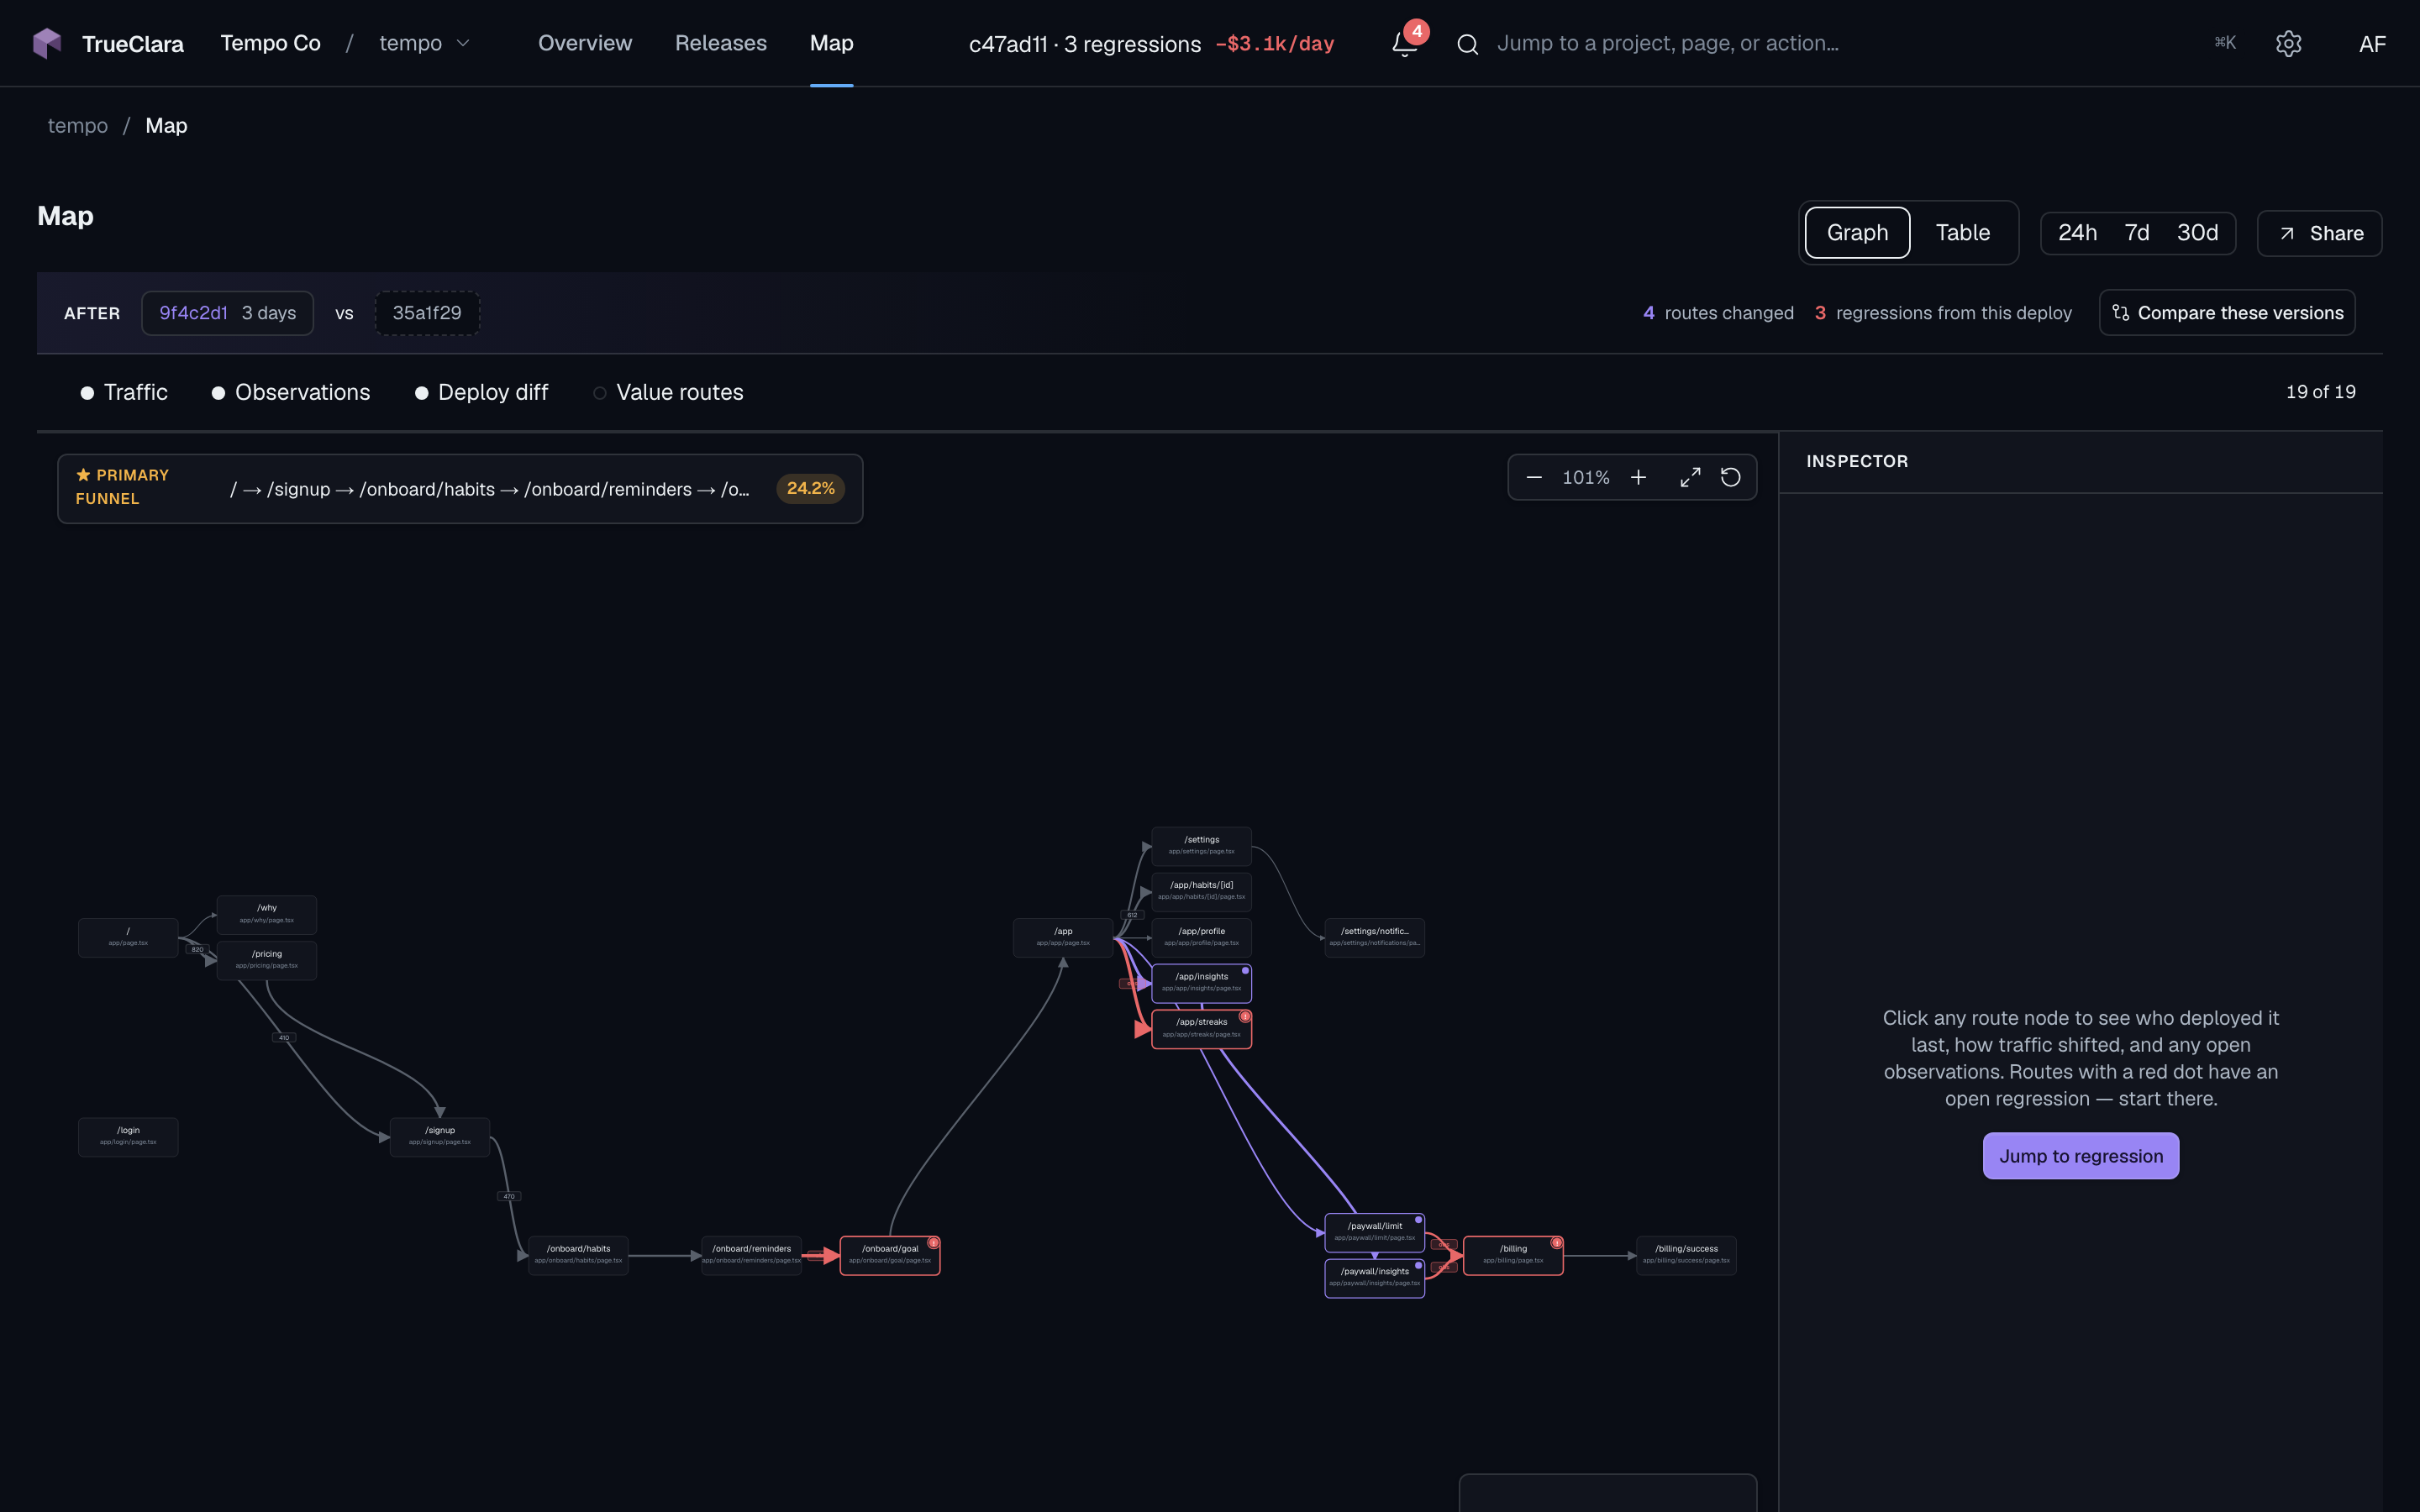
TrueClara turns value-route regressions into deploy-attributed observations: estimated dollar impact, baseline/current rate, threshold state, sample size, and the deploy that caused it — commit SHA, PR, author, and graph snapshot — with full decision history.

01

Revenue estimate

Manual revenue-per-conversion turns the measured value-reach delta into an estimated daily impact, so the alert starts with the business consequence.

02

Route regressions

CUSUM compares route-level value reach during the deploy window against the baseline so small drifts can accumulate into a useful signal.

03

Path regressions

When /pricing to /signup drops, the observation names the broken edge instead of leaving a team to infer it from page views.

Observations List (THEME (light))
Observation types, routing, and severity live on the real project surface buyers will actually use.
Revenue estimate

A value-route drop becomes dollars per day.

Manual revenue-per-conversion turns the measured value-reach delta into an estimated daily impact, so the alert starts with the business consequence.

Estimated $/dayConversion basisCurrency
Observations List (THEME (light))
The list view shows the constrained alert model instead of a generic analytics feed.
Route regressions

Value reach shifts beyond the release baseline.

CUSUM compares route-level value reach during the deploy window against the baseline so small drifts can accumulate into a useful signal.

BaselineCurrentThreshold
Observation Detail (THEME (light))
Detail pages carry route, evidence, deploy, and workflow state together.
Path regressions

The path between two routes loses momentum.

When /pricing to /signup drops, the observation names the broken edge instead of leaving a team to infer it from page views.

From routeTo routeTransition rate
Deploys List (THEME (light))
Every observation points back to the release window that changed behavior.
Resolution

Each card has status and decision history.

The observation can be accepted, resolved, ignored, or marked wrong with the evidence still attached for review.

OpenResolvedWrong call
Project Diagram (THEME (light))
The route graph gives each regression a structural home instead of leaving it as a loose metric.
Deploy attribution

Every observation is anchored to the deploy that caused it.

The commit SHA, PR, author, environment, and versioned graph snapshot become the frame for the regression — so the team reads cause and ownership off the record instead of reconstructing it from deployment logs, and the deploy window is the comparison boundary.

Commit SHA + PRAuthor + environmentGraph snapshot
Deploy attribution1 release frame
Route/checkout
Delta-11.2%
Deploya4f1b29
Before / after · observations

A noisy alert stream becomes a ranked, evidence-backed queue.

CUSUM-detected regressions arrive with baseline, samples, and the responsible deploy attached — so the queue reads as decisions, not a wall of charts.

Alert volume
Revenue and value-route regressions lead the queue.
Every chart can become an alert.
Evidence
Samples, baseline, and deploy attribution travel together.
Screenshots and dashboards are pasted into Slack.
Decision
The responsible commit and decision trail are already present.
The thread asks who shipped it.
Attribution
The deploy window is the comparison boundary, PR and author attached.
Teams guess which release mattered.

Make every alert earn the interruption.

Use deploy-attributed observations so Slack receives decisions, not mysteries.

Curious how the detection actually works? Read the CUSUM change-point detection deep dive →